Type
Process
Solution
Liberty Spark 1.1
Release Date
2nd September 2024
Developer
Netcall
Rating
Description
Reviews
No reviews yet.
Please login to write a review.
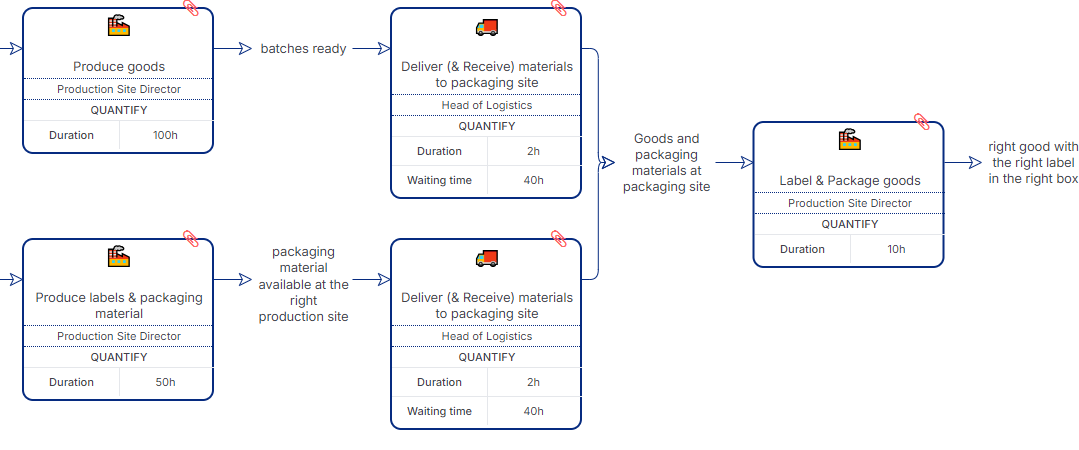
This example process shows how Liberty Spark can be used for Value Stream Mapping.
This example process shows how Liberty Spark can be used for Value Stream Mapping.
Each activity in the process uses Icons to highlight the type of activity.
The Quantify form is used to capture duration and waiting time.
This information is shown on the box using the Forms Visibility feature.
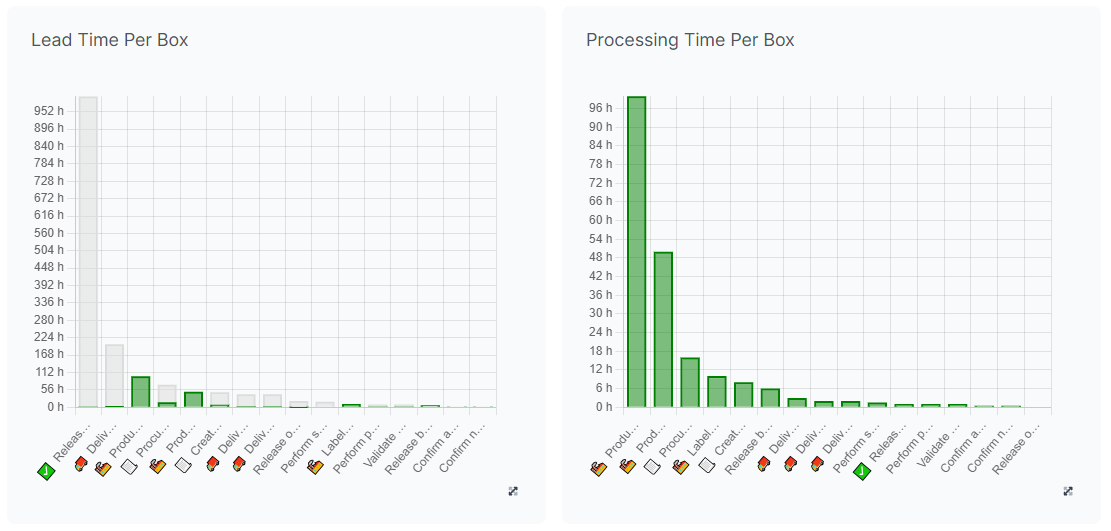
Not only does this provide a visual analysis of the process but users can also run Spark's in built quantification analysis and simulation.
Simple open Business Tools > Quantify to explore the impact of changes to the process.
This process example also include glossary items for Production Plan and Distribution Centre.
This demonstrates how you can use the in built glossary to link detailed definitions into your process descriptions.
Please login to write a review.


